All posts by technosolut

GEグローバル・イノベーション・バロメーターの結果から想うこと

GEグローバル・イノベーション・バロメーターという調査があることをご存じでしょうか。GE (General Electric Company) によるイノベーションの現況に関する意見の聞き取り調査です。2016年1月に第5回目の調査結果が発表されました。発表されてから既に1年半以上が経過しています。ここでは、もはや旧聞に属する調査本来の結果に関してではなく、若干変わった視点からこの調査の結果に対して感じたことを記します。

■ イノベーション・チャンピオン-日本がアメリカに次いで2位に

GEグローバル・イノベーション・バロメーター調査では世界23カ国にまたがって、各国企業のイノベーション担当幹部に聞き取りを行っています。その総数2,748名、もちろん日本も対象国となっており、103人の企業幹部が聞き取りを受けています。その詳しい内容は原典*を当たっていただくとして、イノベーションに関する現下の中心課題を第4次産業革命やデジタル革命と見立て、これを軸に調査は構成されています。
*https://www.ge.com/jp/sites/www.ge.com.jp/files/2016-GEIB-Full-Findings_FINAL.pdf

まずは、「イノベーション・チャンピオンはどこの国ですか」という設問です。結果は、日本がアメリカに次いで堂々2位にランクされました。前回調査時との比較で5ポイントの増加、前回2位のドイツと入れ替わったとのこと。日本のイノベーション基盤は上昇傾向にあると世界のイノベーション担当企業幹部から思われているわけです。

出所: 2016 GE Global Innovation Barometer p.8

この調査ではイノベーション担当企業幹部だけではなく、有識市民に対しても同様の聞き取りを行っています。この結果でも日本はアメリカに次いで2位にランクインしており、企業の幹部だけでなく市民有識層からも日本のイノベーション基盤の高さが評価された結果となりました。ちなみに3位は企業幹部の間ではドイツ、4位が中国でした。有識市民への調査ではこれが逆転し、3位が中国、4位がドイツとなっています。
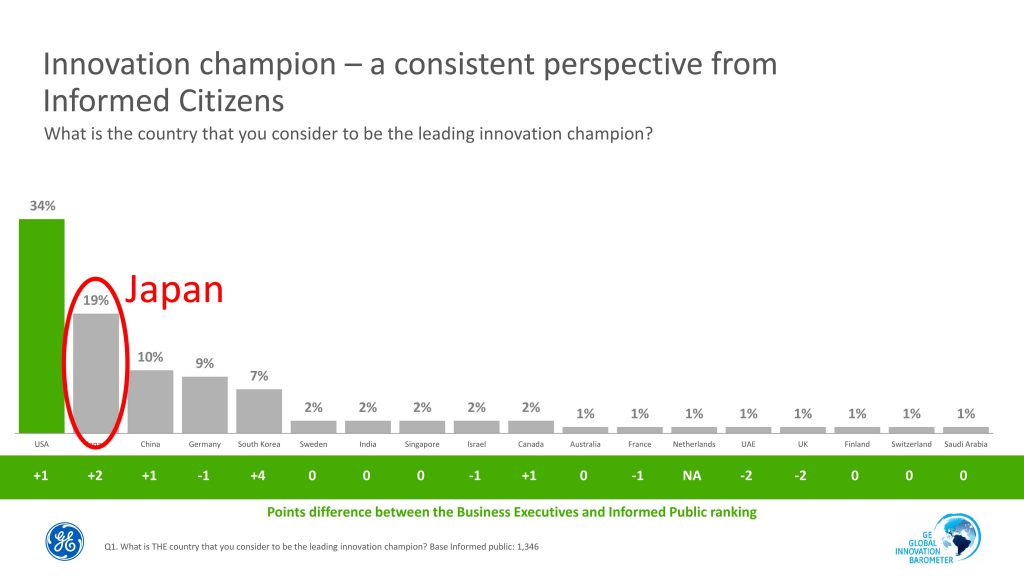
Innovation champion – a consistent perspective from Informed Citizens
出所: 2016 GE Global Innovation Barometer p.9

■ 日本の企業幹部はどう思っているのか…

この結果を見て、日本もやるではないかと自賛的な紹介をするのが本稿の目的ではありません。イノベーション基盤などというものは1年や2年でそうそう変わるもものではなく、短い期間での順位の入れ替えに一喜一憂することに積極的な意味は見いだせないからです。では何故ここで、GEグローバル・イノベーション・バロメーターの結果を取り上げるのか。それは設問に対する日本企業のイノベーション担当幹部の回答結果に興味を惹かれたからです。

例を挙げましょう。「第4次産業革命の進展をどう捉えていますか」、こんな質問が発せられています。「第4次産業革命」とは、インダストリー4.0やインダストリアル・インターネットと呼ばれることもある、最近のイノベーションを象徴するコンセプトです。様々なセンサーを配した機械設備をインターネットに接続することでデータの遣り取りを通じた最適なオペレーションを実現し生産性を飛躍的に向上させる、一般的(というか私)にはこのように理解されています。

さて、この問いかけに対し日本企業のイノベーション担当幹部はどう答えたでしょうか。以下のグラフは、第4次産業革命の進展を前向きに捉えた回答の比率を国毎に示しています。前向きに捉えた日本の企業幹部の比率は33%、ダントツの最下位でした。世界の人々からは、日本がイノベーション・リーダーとして高く評価されているにもかかわらずです。
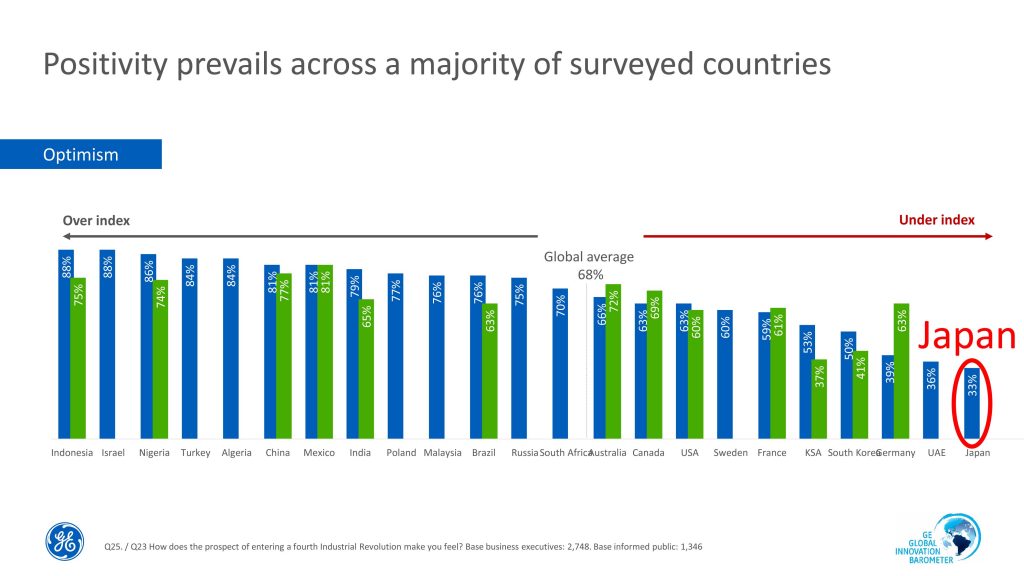
Positivity prevails across a majority of surveyed countries
出所: 2016 GE Global Innovation Barometer p.13

このような回答の傾向は調査全般を通じて随所に見られるのですが、その幾つかを以下に紹介します。すぐ下のグラフは、「あなたの会社は明確なイノベーション戦略を持っていますか」との問いに対する回答結果です。持っていると答えた比率は38%、やはりダントツの最下位です。さらにその下のグラフ、「あなたの会社はイノベーション実現のための長期的な投資に前向きですか」との問いかけに対して強い肯定を示した日本企業幹部の比率なのですが、なんとたったの4%。他国に比して極端ともいえる低い比率なのです。
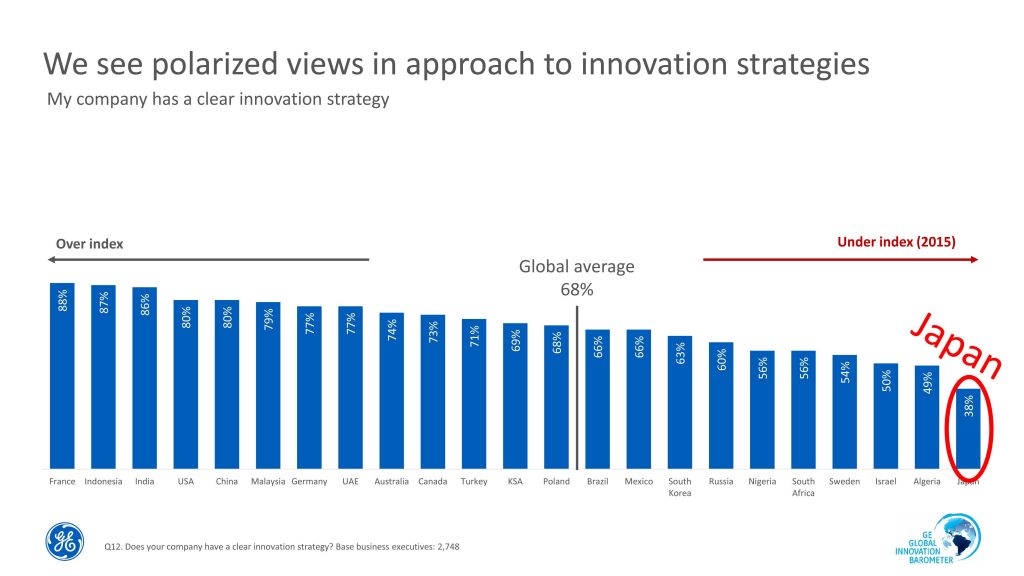
We see polarized views in approach to innovation strategies出所: 2016 GE Global Innovation Barometer p.37
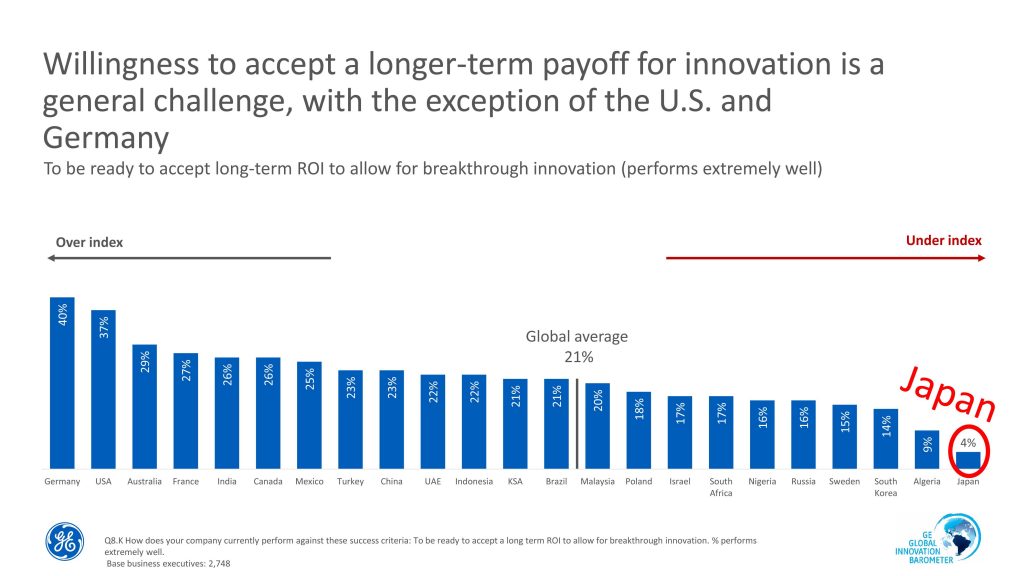
Willingness to accept a longer-term payoff for innovation is a general challenge出所: 2016 GE Global Innovation Barometer p.40

■ どう理解したらいいの?-私の解釈

個々のグラフはこれ以上示しませんが、上記に示した事例以外でも日本企業のイノベーション担当幹部の答え振りは他国のそれと比べて特異な結果が多いのです。イノベーション・チャンピオンで順位を上げて2位にランクインした、といったことよりも日本企業のエグゼクティブ(その多くは日本人でしょう)の回答が特異値を示すことの方に強い興味を持ちます。一体、このような結果をどのように理解したらいいでしょうか。

とりあえずの解釈としては以下の2種でしょうか。

① 特異値であろうと、調査の結果は真実を表しているはず。真実とは、日本の企業エグゼクティブが持つイノベーションに係る認識そのもの。無論ここで示されるのは「認識」であって、例えば日本企業が明確なイノベーション戦略を実際に持っているか否かという「事実」ではない。

② 特異値とは、質問に対する回答の傾向を他国の企業エグゼクティブと比較して特異だということ。このような調査に対する日本人の回答には特有のバイアスが働き、表象的な数値は低めにでるもの。従って、示された見解は割り引いて(嵩上げして)考えるべき。

GEグローバル・イノベーション・バロメーター調査が実際にどのような手順で行われ、また聞き取り対象となったイノベーション担当の企業幹部が実際に誰であったのかは、もちろん定かではありません。まして私は、社会調査の専門家でもなければ、日本人論の専門家でもありません。「特異値」の解釈に関し論理的な結論を出すつもりなどなく、また出せるものでもありません。

と前置きした上で感じることは、他国に比べて低い数字の出る質問は自己評価に関連するものが多いということです(全ての質問に日本の企業幹部が低く答えているわけではありません)。加えて、新しいと思える技術なり社会への適応を問う質問に関しても、低めの数字が出ているようです。もっとも、こうした適応を問う質問は自己の適応力を問うことになるわけですから、これも自己評価の一端です。やはり、自己評価は低く出る傾向にあるわけです。

日本人特有のバイアスに関しては、この調査が質問票への単なる記入調査ではなく個々の回答者と面談の上で結果を得ていることから、仮に存在したとしても相当に影響は減じられているのではないかと考えられます。さらに、回答者は企業幹部です。対面調査に臆したという可能性は高くないでしょう。

以上からは、日本の企業幹部はイノベーションに関する自己能力を実際に低いものとして認識、評価しているということです。さらに、こうした自己認識、自己評価は他者が日本に対して持つ認識、評価と比べて著しく低いということです。

■ 克服すべきは

端的にいえば、自信がないということなのではないでしょうか。この調査はイノベーションの現況に関連して様々な認識を問うものです。現下のイノベーションのトピックはデジタル革命、インダストリー4.0、若しくはインダストリアル・インターネットといった概念です。質問もこうした概念の存在を前提に作られています。そして、こうした概念で語られるビジネス・フィールドでは、日本企業は世界の競合企業に近年は負け続けているとの認識が支配的です。特に既存の大企業においては、こうした意識が顕著でしょう。

そうした意識に縛られていればこそ、イノベーションの現況に関連した自己評価は低くならざるを得ないのです。苦手意識があれば、選択を迫られたときにはより確実で安全な路線を進むことになるのではないでしょうか。新たな技術の社会実装、これなくしてイノベーションは生起しないわけですが、これを人の後を追う安全と思える路線で進めることは、現下の技術及びビジネス環境下では、安全策には決してなり得ません。

苦手意識の払拭、これこそが第4次産業革命と喧伝される技術及びビジネス環境下での飛躍を求める日本企業にとって、克服すべき最初の課題と思えてなりません。GE調査の結果を見て、そんな風に感じた次第です。


Population in Japan (Part 2) – Rapid Change in Demography

■ Demographic Situation in Each

These demographical features are very useful to judge the market of a country. Age distribution as well as a growth rate of population tell us if the country is staying young and still growing in population or if the country has already been matured and cannot expect more population growth.

Consumer’s preferences on the market highly depend on these demographic situation. In Part 1 of this agenda we said the world is aging. Then how about the situation in each country? What factors affect the degree of aging in each country? To answer these questions, Figure 4 is prepared below.

 Fig.4 World Population of Age 65 or Above

Fig.4 World Population of Age 65 or AboveSource: World Development Indicator, World Bank

This figure shows percentage of age 65 or above out of total population by income level. There is 16% of age 65 or above out of total population in high income economies when only 6% in low and middle income economies.

Here, high-income economies are those in which 2014 Gross National Income (GNI) per capita was $12,736 or more. Low and middle-income economies are those in which 2014 GNI per capita was $12,735 or less.

It is vital to note that a degree of aging is different among countries. Wealthy countries are aging more rapidly than other countries. You may be able to understand this intuitively. One effective reason for this is that life expectancy in wealthy countries is longer than those of less wealthy. Yes, the higher the income, the longer you can live.

■ How About Japan?

Now we move on to Japan. Previous discussion was in some sense a preparation of the introduction of Japan’s situation. Having said that, let’s move our eyes on the next figure, Figure 5. This figure exactly presents what Japan’s data has been added on Figure 4.

Fig.5 World Population of Age 65 or Above #2

Fig.5 World Population of Age 65 or Above #2Source: World Development Indicator, World Bank

High-income economies exceed low and middle-income economies in post-productive population ratio, and Japan exceeds high-income countries with wide margin. Besides, change has occurred in a very short notice. This rapid change of demography impose tremendous adaptation on Japan’s society.

Figure 6 is a Japanese version of Figure 3 presented in Part 1, which expresses the world population and its annual growth rate. You can find out that Japan seems to have passed a peak of not only growth rate but also population itself already.

Fig.6 Growth Rate of Japan’s Population

Fig.6 Growth Rate of Japan’s PopulationSource: Population Census, Statistics Bureau, Ministry of Internal Affairs and Communications

Statistic says that Japan’s population has turned to decrease since 2011. The trend will lead Japan’s population to decrease more. Of course there are lots of countries in which population is decreasing. However, Japan’s change is characterized by its speed.

■ Rapid Change

For expressing rapid change in Japan, annual growth rate of population both in Japan and the world are plotted in the same graph as shown Figure 7.

Fig.7 Growth Rate in the World and Japan

Fig.7 Growth Rate in the World and JapanSource: Population Census, Statistics Bureau, Ministry of Internal Affairs and Communications and World Development Indicator, World Bank

Both growth rates look like staying on the same trend until the beginning of 1960. Then both came to their peaks. Yes, both behaved similar. Besides, the peak year of growth rate on the world seems to come earlier than the peak year of Japan.

But rapid decline of Japan’s growth rate has led Japan’s population decrease since growth rate marks negative in recent years. As a result of rapid decline of the rate, population of productive age as well as pre-productive age is decreasing as shown in Figure 8.

Fig.8 Japan’s Population by Age Group

Fig.8 Japan’s Population by Age GroupSource: Population Census, Statistics Bureau, Ministry of Internal Affairs and Communications
■ For Finding an Effect of Aging

Having kept in mind that Japan is aging much more rapidly than any other country in the world, we will focus on Japan’s demographic situation deeply as the next topic apart from international comparison.

Though looking at the situation deeply, the main purpose here in this Home Page is not for exploring a mechanism of rapid aging but for finding an effect of aging on consumer’s behavior. Aging may have a negative effect on productive activity, but it may create a new business opportunity in a market.

Detailed discussion along with the purpose will be tackled.

Population in Japan (Part 1) – Situation in the World

■ Population is a Key to Understand Nations

Population is one of the most distinguish features to determine a situation of a certain country. Age distribution as well as a growth rate of population may represent which stage the country belong to. It helps us determine if the country is staying young and still growing in population or if the country has already been matured and cannot expect more population growth.

These demographical features are very useful to judge not only the country itself, but also the market of a country. Consumer’s preferences on the market highly depend on society’s atmosphere and society’s atmosphere may get a great influence from the stage which the country belong to.

Keep these ideas within your mind, let’s take a look at the situation of the population in Japan. To describe Japan’s characteristics in population, we slightly touch upon recent world situation in population.

■ Situation in the World

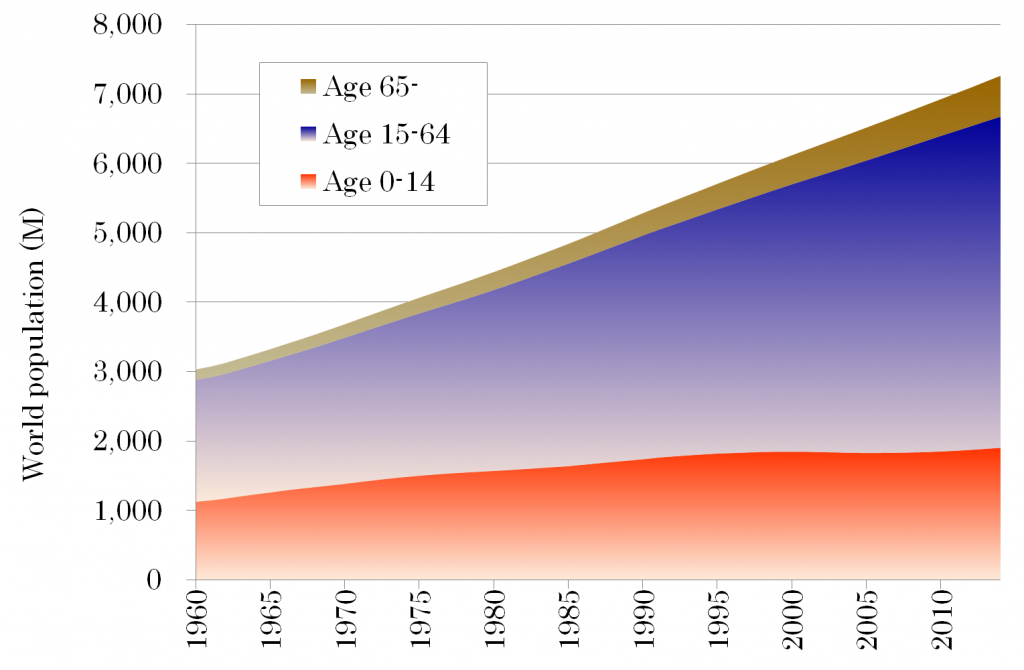
Figure 1 shows the world population trend by three age groups such as age 14 or less, age 15 to 64 and age 65 or above. Age group of 15 to 64 is regarded as productive population which may contribute to productive activity. All age groups seem to be growing stable from the graph.

Fig.1 World Population

Fig.1 World PopulationSource: World Development Indicator, World Bank

So we describe the percentage of world population by age group in Figure 2. This graph figures out exact behavior of their trends.

Fig.2 World Population by Age Group

Fig.2 World Population by Age GroupSource: World Development Indicator, World Bank
Various interpretations come up with this graph. One thing that can be clearly inferred here is that the world is aging. Though the percentage of the population in production age which ranges 15 to 64 is still increasing gradually, the percentage of the population in pre-productive age which is 14 or less is decreasing. This means the percentage of the production age will be decreasing in the long run.

■ Peak Has Gone

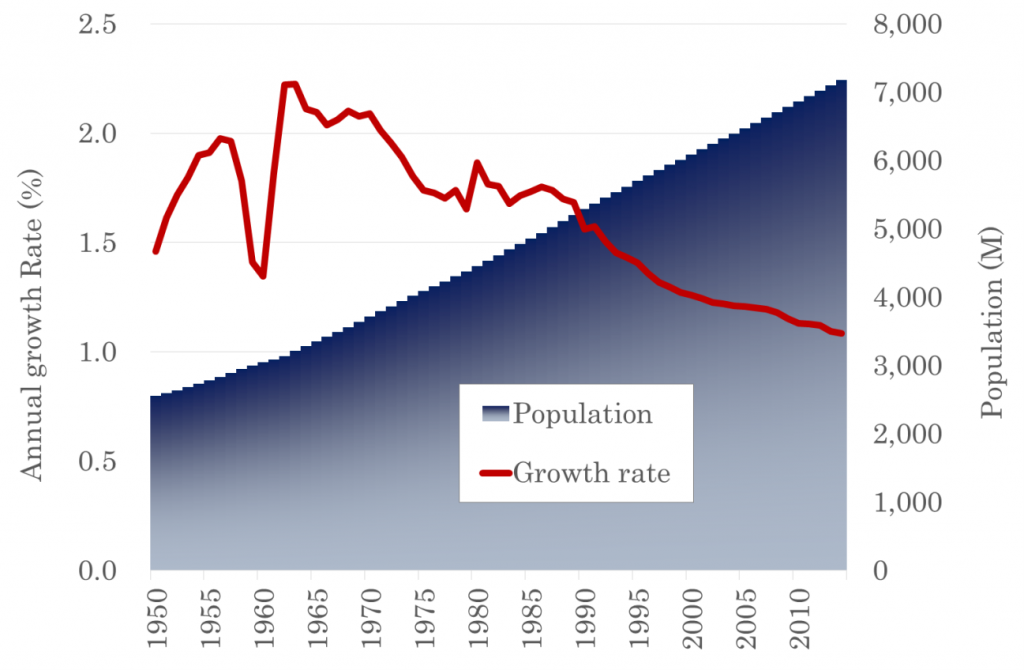
To make this point sure, please take a look at the next graph, Figure 3. This figure expresses the world population growth rate annually as well as the world population itself.

Fig.3 Growth Rate of World Population

Fig.3 Growth Rate of World PopulationSource: International Data Base, U.S. Census Bureau

The world population growth rate rose from about 1.5 percent per year from 1950-51 to a peak of over 2 percent in the early 1960s due to reductions in mortality. Growth rates thereafter started to decline due to rising age at marriage as well as increasing availability and use of effective contraceptive methods.

It is noted that changes in the population growth have not always been steady. There are various factors which may influence growth rate of population. For example you can find a dip in the growth rate from 1959-1960. It is said that the dip was due to the Great Leap Forward in China. During that time, both natural disasters and decreased agricultural output in the wake of massive social reorganization caused China’s death rate to rise sharply and its fertility rate to fall by almost half.*
*https://www.census.gov/population/international/data/idb/worldgrgraph.php

However, trend outline is obvious that the peak of growth rate has already gone. Still the world population is increasing since a growth rate is positive. But the total number of the world population will saturate sooner or later.

It means that a percentage of pre-productive population out of total population is decreasing and a percentage of post-productive population is increasing. Figure 2 exactly shows this phenomenon.

(To be continued to Part 2 of this agenda.)