■ Population is a Key to Understand Nations
Population is one of the most distinguish features to determine a situation of a certain country. Age distribution as well as a growth rate of population may represent which stage the country belong to. It helps us determine if the country is staying young and still growing in population or if the country has already been matured and cannot expect more population growth.
These demographical features are very useful to judge not only the country itself, but also the market of a country. Consumer’s preferences on the market highly depend on society’s atmosphere and society’s atmosphere may get a great influence from the stage which the country belong to.
Keep these ideas within your mind, let’s take a look at the situation of the population in Japan. To describe Japan’s characteristics in population, we slightly touch upon recent world situation in population.
■ Situation in the World
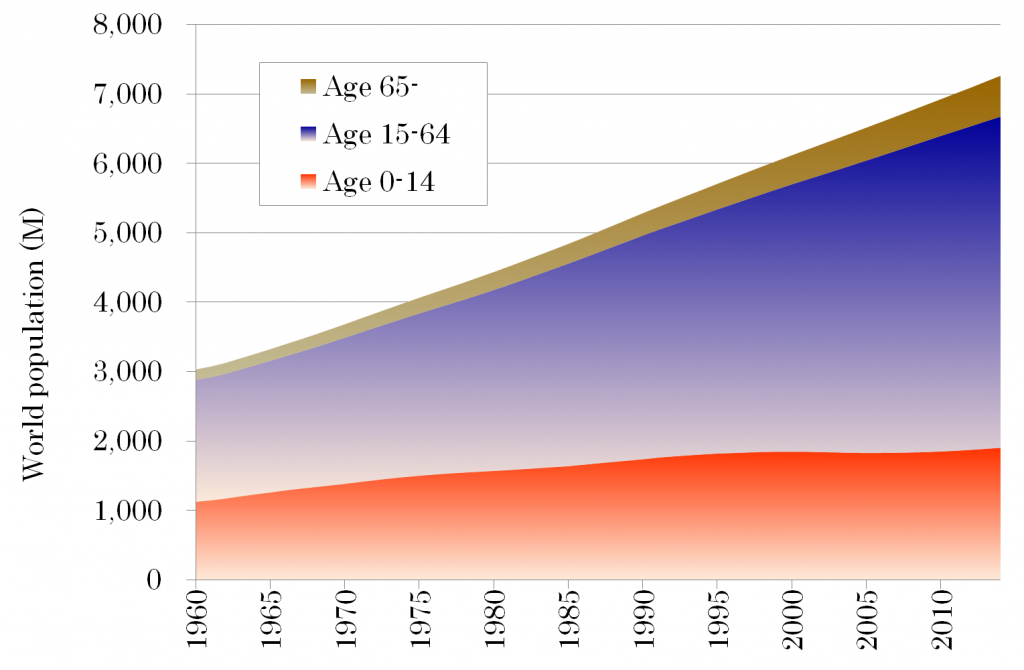
Figure 1 shows the world population trend by three age groups such as age 14 or less, age 15 to 64 and age 65 or above. Age group of 15 to 64 is regarded as productive population which may contribute to productive activity. All age groups seem to be growing stable from the graph.
Fig.1 World Population
 Source: World Development Indicator, World Bank
So we describe the percentage of world population by age group in Figure 2. This graph figures out exact behavior of their trends.
Fig.2 World Population by Age Group
 Source: World Development Indicator, World Bank
Various interpretations come up with this graph. One thing that can be clearly inferred here is that the world is aging. Though the percentage of the population in production age which ranges 15 to 64 is still increasing gradually, the percentage of the population in pre-productive age which is 14 or less is decreasing. This means the percentage of the production age will be decreasing in the long run.
■ Peak Has Gone
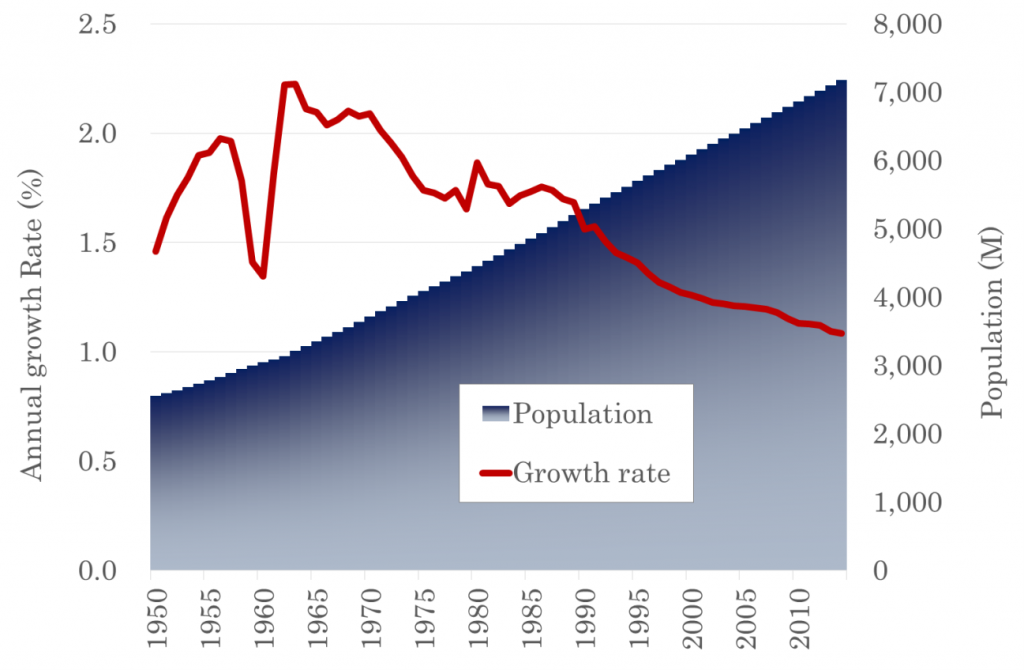
To make this point sure, please take a look at the next graph, Figure 3. This figure expresses the world population growth rate annually as well as the world population itself.
Fig.3 Growth Rate of World Population
 Source: International Data Base, U.S. Census Bureau
The world population growth rate rose from about 1.5 percent per year from 1950-51 to a peak of over 2 percent in the early 1960s due to reductions in mortality. Growth rates thereafter started to decline due to rising age at marriage as well as increasing availability and use of effective contraceptive methods.
It is noted that changes in the population growth have not always been steady. There are various factors which may influence growth rate of population. For example you can find a dip in the growth rate from 1959-1960. It is said that the dip was due to the Great Leap Forward in China. During that time, both natural disasters and decreased agricultural output in the wake of massive social reorganization caused China’s death rate to rise sharply and its fertility rate to fall by almost half.*
*https://www.census.gov/population/international/data/idb/worldgrgraph.php
However, trend outline is obvious that the peak of growth rate has already gone. Still the world population is increasing since a growth rate is positive. But the total number of the world population will saturate sooner or later.
It means that a percentage of pre-productive population out of total population is decreasing and a percentage of post-productive population is increasing. Figure 2 exactly shows this phenomenon.
(To be continued to Part 2 of this agenda.)